Details
Service TypeOther Business Services
Description
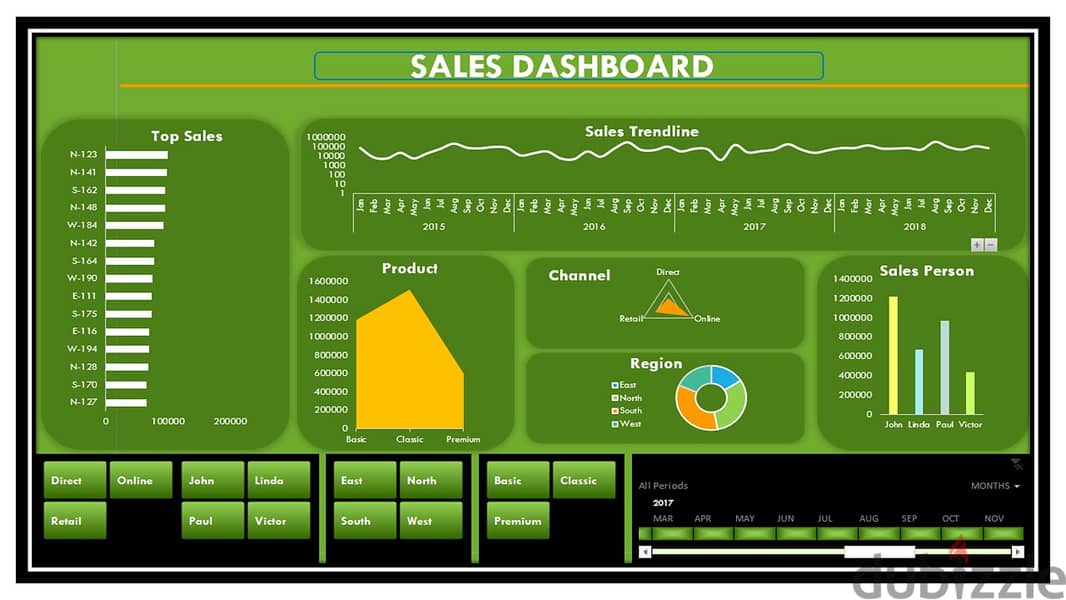
Create a dashboard for data analysis using Excel
Dashboard - pivot table through:
Formatting and clarifying data to perform any data analysis
* Using tables in Excel (pivot tables and dynamic tables)
* Use conditional formatting
* A program for sales, revenues, profit and loss (with an amendment according to the company's activity).
* Assisting in data entry and processing
Basic: Dashboard (make a worksheet (4 charts, 100 rows)
Location
Egypt
Ad id 197734863
Report this ad
This ad is no longer available
Your safety matters to us!
- Only meet in public / crowded places for example metro stations and malls.
- Never go alone to meet a buyer / seller, always take someone with you.
- Check and inspect the product properly before purchasing it.
- Never pay anything in advance or transfer money before inspecting the product.
